
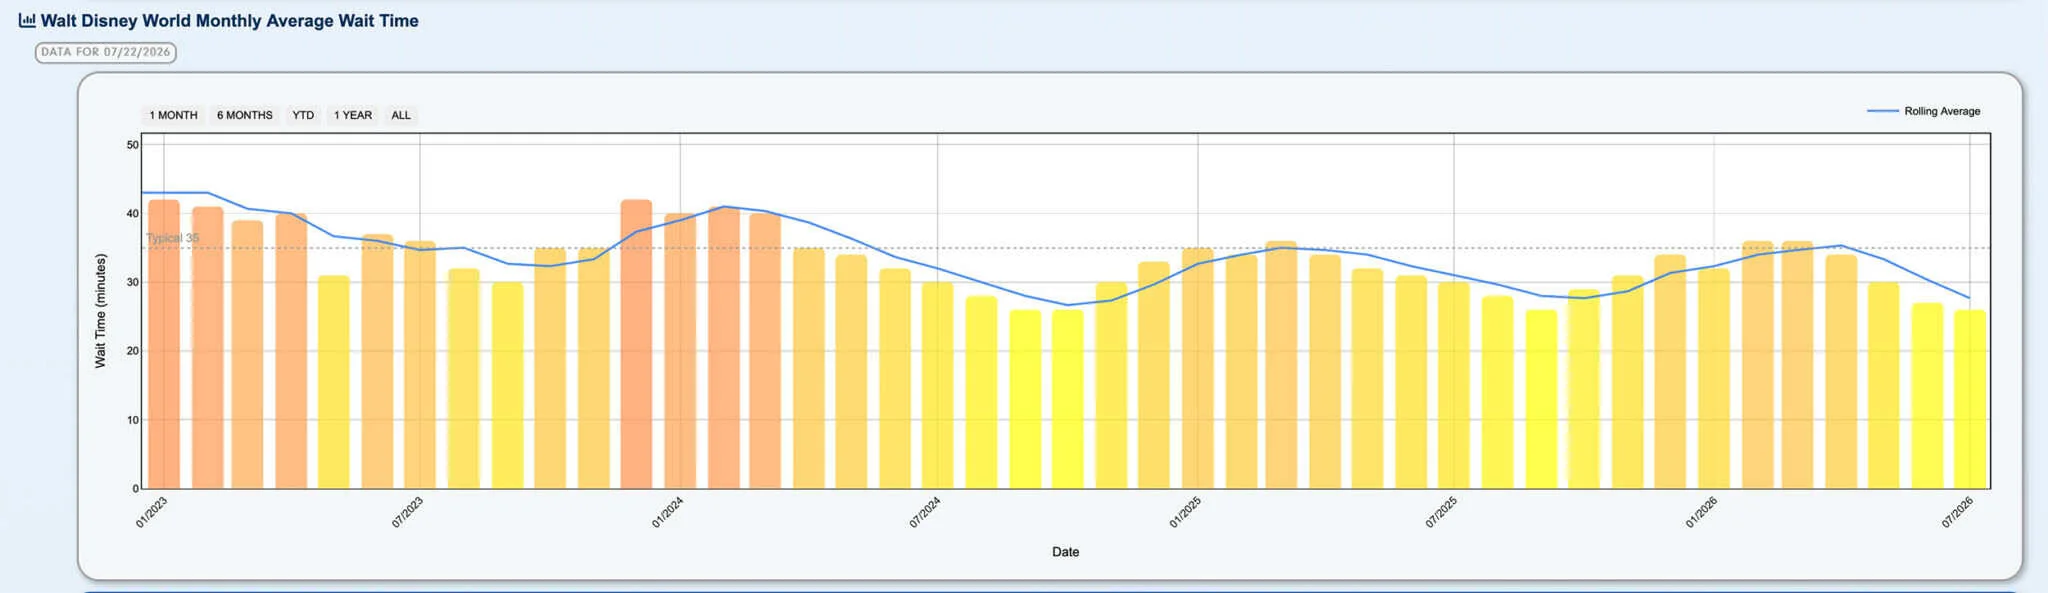
Disney World feels quieter this summer because the posted-wait data is quieter too. Average waits in June and July 2026 are running about 13% below the same months last year.
That does not make the parks empty, and it does not guarantee a short line at every headliner. It does mean summer visitors have had more flexibility than the usual heat-and-crowd reputation suggests.
In This Article
- June and July wait-time drop
- 2025 versus 2026 comparison
- Why posted waits need context
- What lower averages change
- Day-of touring strategy
Disney World Summer Wait Times: 2025 vs. 2026
| Month | 2025 average | 2026 average | Change |
|---|---|---|---|
| May | 32 minutes | 30 minutes | Down 6.25% |
| June | 31 minutes | 27 minutes | Down about 13% |
| July | 30 minutes | 26 minutes | Down about 13.3% |
The comparison uses captured posted waits from Thrill-Data across Walt Disney World attractions and experiences from 10 a.m. to 5 p.m. July is still incomplete, so its final monthly number can move.
Is Disney World Really Less Crowded?
The safest conclusion is that posted waits are lower. Wait data alone cannot prove attendance because attraction capacity, downtime, staffing, and how Disney posts estimates all influence the average.
Still, the trend is broad enough to matter. June’s 27-minute average and July’s current 26-minute average are as low as, or lower than, recent September figures. July 2026 is currently tied for the lowest monthly average in the recent comparison.
What a 13% Drop Means for a Park Day
A four-minute reduction in a resort-wide average sounds small. Across six or eight attractions, however, lower waits can return meaningful time for a meal, a show, or an afternoon break.
It does not mean every ride is 13% faster. Slinky Dog Dash, Seven Dwarfs Mine Train, Flight of Passage, and other headliners can remain busy while lower-demand attractions pull the overall number down.
Why Summer Can Feel Slower and Harder at the Same Time
Heat and afternoon storms can discourage long outdoor days even when attraction waits are manageable. A low monthly average also hides short surges after rain, ride reopenings, meals, and nighttime entertainment.
Disney has not identified one cause for the current trend. A summer without a brand-new land, vacation-price pressure, weather, and travelers shifting to other seasons are reasonable possibilities, but they remain analysis rather than confirmed explanations.
How to Use the Lower-Wait Trend
- Keep an early start: lower averages do not erase rope-drop value at the most popular ride.
- Use live waits: the current park is more useful than a monthly average when choosing the next attraction.
- Plan a heat break: a flexible afternoon can matter more than squeezing in one extra low-wait ride.
- Expect weather movement: outdoor ride closures can push guests into indoor queues quickly.
- Do not overbuy urgency: check actual waits before assuming every day requires the most expensive line-skipping option.
At Animal Kingdom, the new Discovery Island rope-drop checkpoints still make route choice important even on a low-average day. Resort-wide data never replaces the layout and demand pattern of the park in front of you.
What Could Change the Trend?
Promotions, school calendars, attraction downtime, and new openings can all move waits. Tropical Americas at Animal Kingdom may create new demand in 2027, but Disney has not promised that the land will open in time to change next summer.
For now, treat summer 2026 as a useful opportunity, not a guarantee. Would lower waits make you choose a hot July trip over a cooler but busier season? Let us know in the comments below; we would love to hear how you balance weather and crowds.
About The Author

 Follow Us on Mastodon